Using Gantt charts for project planning has become a staple in the toolkit of project managers worldwide. These visual tools provide a clear overview of project timelines, tasks, and dependencies, making them invaluable for effective project management. In this article, we’ll explore how Gantt charts work, their benefits, and practical tips for using them effectively in your projects.
What is a Gantt Chart?
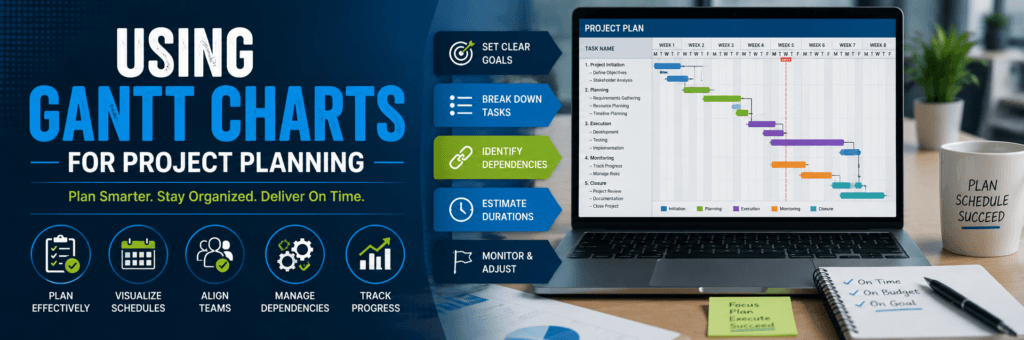
A Gantt chart is a type of bar chart that represents a project schedule. It displays the start and finish dates of various elements of a project, including tasks, milestones, and dependencies. By visualizing the timeline of a project, Gantt charts help teams understand how tasks overlap and how long each task will take.
Real-Life Example: Planning a Marketing Campaign
Imagine you’re managing a marketing campaign for a new product launch. You need to coordinate various tasks such as market research, content creation, social media promotions, and event planning. By using a Gantt chart, you can lay out all these tasks visually, showing when each task starts and ends, who is responsible for each task, and how they depend on one another. This clarity helps ensure everyone is aligned and aware of their responsibilities.
Benefits of Using Gantt Charts
1. Improved Planning and Scheduling
Gantt charts allow project managers to plan tasks in a logical sequence. By visualizing the entire project timeline, you can identify potential bottlenecks and allocate resources more effectively.
Practical Advice
- Identify Critical Path: Use the Gantt chart to determine which tasks are critical to the project’s success. Focus on these tasks to ensure timely completion.
- Set Realistic Deadlines: By considering task durations and dependencies, you can set achievable deadlines that keep the project on track.
2. Enhanced Communication
A Gantt chart serves as a central reference point for team members. Sharing this visual tool with your team fosters better communication and collaboration.
Example: A Construction Project
In a construction project I managed, we used Gantt charts to communicate timelines with subcontractors. By sharing the chart during weekly meetings, everyone could see how their work fit into the overall schedule. This transparency reduced misunderstandings and helped keep the project on schedule.
3. Effective Resource Allocation
Gantt charts help visualize resource requirements for each task. This enables project managers to assign the right people to the right tasks while avoiding overloading any team member.
Personal Anecdote
When I was leading a software development team, we faced resource constraints due to overlapping projects. By using a Gantt chart, we identified which developers were available for specific tasks and adjusted assignments accordingly. This approach not only improved efficiency but also boosted team morale as workloads were balanced more effectively.
4. Progress Tracking
One of the most significant advantages of Gantt charts is their ability to track progress visually. As tasks are completed or delayed, you can update the chart to reflect the current status.
Practical Advice
- Regular Updates: Schedule regular check-ins to update the Gantt chart based on task completion or changes in timelines.
- Use Color Coding: Implement color coding to indicate completed tasks, those in progress, and overdue items for quick visual reference.
5. Better Risk Management
By identifying dependencies between tasks, Gantt charts help project managers foresee potential risks that could impact timelines or resources.
Example: Identifying Dependencies
In one project I oversaw, we identified that delays in obtaining permits would affect subsequent construction phases. By recognizing this dependency early through our Gantt chart, we were able to expedite permit applications and mitigate potential delays later in the project.
How to Create an Effective Gantt Chart
Step 1: Define Your Project Scope
Start by outlining all the tasks required to complete your project. Break down larger tasks into smaller subtasks for better clarity.
Step 2: Determine Task Durations
Estimate how long each task will take based on past experiences or input from team members who will be executing those tasks.
Step 3: Identify Dependencies
Determine which tasks depend on others being completed first. This step is crucial for creating an accurate timeline.
Step 4: Use Project Management Software
Utilize tools like Microsoft Project, Asana, or Trello that offer built-in Gantt chart functionalities. These platforms make it easy to create and update your charts as needed.
Step 5: Share with Your Team
Once your Gantt chart is ready, share it with your team members. Encourage feedback and make adjustments based on their insights.
Conclusion
Gantt charts are powerful tools that enhance project planning by providing clear visual representations of timelines, tasks, and dependencies. By improving planning and scheduling, enhancing communication among team members, facilitating effective resource allocation, tracking progress efficiently, and aiding in risk management, they can significantly contribute to successful project outcomes.
As you consider implementing Gantt charts in your own projects or support others through this process, remember that clarity and communication are key components of effective project management. With careful planning and regular updates to your Gantt chart, you can navigate complex projects with confidence while keeping your team aligned toward shared goals!